
Transitioning from the Scholander Pressure Chamber to FloraPulse Sensors
720 Olive Dr Ste E
Davis CA, 95616
(530) 220-7668
1. Big picture: same concept, new tool
If you’ve been using the Scholander pressure chamber (“pressure bomb”), you’re already measuring the right signal: stem water potential (SWP). FloraPulse measures that same signal inside the tree, just in a different place and continuously instead of once a week.
- Pressure chamber: cut a leaf, bag it, take it to the chamber, and pressurize until sap appears. That gives you leaf water potential at that instant.
- FloraPulse: a microtensiometer is installed in the trunk or a scaffold branch. It measures water potential in the xylem every ~20 minutes and sends it to the online dashboard.
So your fundamental irrigation idea doesn’t change:
- You still target a midday SWP range (e.g. “keep almonds between –10 and –14 bar in mid-summer”).
- You still irrigate when the trees approach the drier edge of that range.
- You just read that number from FloraPulse instead of from the pressure chamber.
Think of it as moving your pressure chamber inside the tree and letting it run automatically.
2. How FloraPulse numbers compare to your pressure chamber
Trunk vs. leaf
FloraPulse lives in the trunk; the Scholander measures a leaf. That creates a small, predictable difference:
- When trees are well hydrated (wetter than about –9 bar), FloraPulse tends to read about 2–3 bar “wetter” (less negative) than the pressure chamber.
- As trees dry past about –10 bar, the trunk and leaf readings come together and track each other more closely. This matches what’s been seen in almond and other validated crops, where sensors generally match the bomb or run only 1–3 bar wetter in the milder-stress spring period.
That offset is normal: the trunk is slightly “upstream,” so it doesn’t have to pull quite as hard as the leaves.
Timing (the daily minimum)
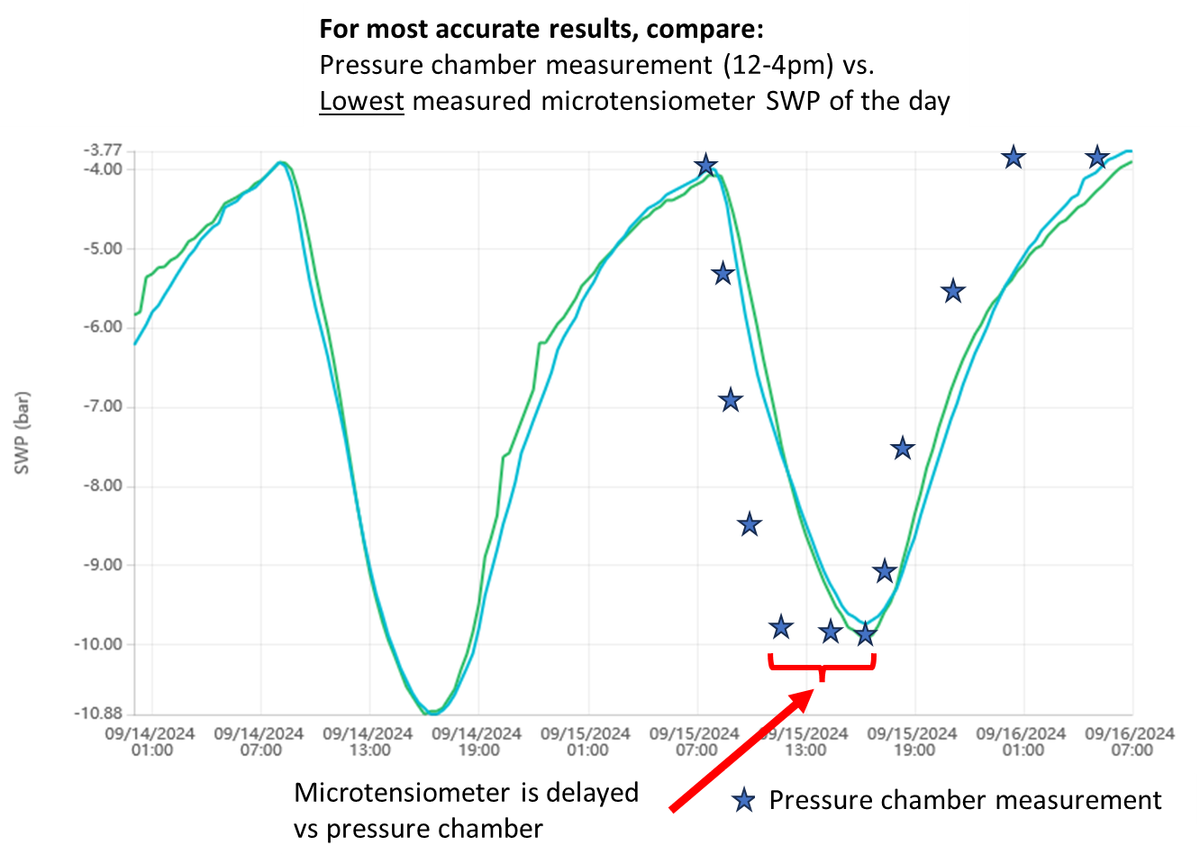
The sensor itself responds in under 15 minutes, but water movement through the wood and mating compound means the measured minimum (midday SWP) can lag by 1–3 hours.
In practice:
- The tree’s true minimum water potential usually happens around 12–2 pm.
- FloraPulse often reaches the same minimum between ~2–4 pm.
- The tree typically sits near that minimum for ~4 hours, so the lag doesn’t change the stress level you care about.
On the dashboard, FloraPulse simply defines “midday SWP” as the lowest (most negative) value recorded that calendar day — the driest point the tree hit.
Visual example
Below is a typical comparison. Stars are pressure-chamber readings; the smooth line is FloraPulse SWP. The minimum value is the same, but the sensor reaches it a bit later:
The take-home:
- Shape and minimum depth match → both tools see the same stress.
- Timing and a small offset when trees are very wet are expected and not a problem for irrigation decisions.
3. Using your existing pressure-chamber thresholds with FloraPulse
Here’s the key simplification: you can keep using the same SWP thresholds you already use with the pressure chamber. No need to invent “new FloraPulse numbers.”
Why this works:
- Same physiological variable. All of the classic guidelines (for almond, walnut, prune, grapes, etc.) are written in terms of stem water potential in bars, not “pressure-chamber units.” FloraPulse is calibrated to absolute SWP too, so –12 bar of stress is –12 bar, no matter which instrument measured it.
- Validated against the pressure chamber. In core crops like almond, prune and grapes, FloraPulse data have been compared extensively to Scholander measurements. The sensors track the same trends and stress levels, with minor offsets at the “very wet” end and generally good agreement in the drier range where irrigation decisions are usually made.
- Guidelines are ranges, not razor-thin lines. The recommended bands (for example, almonds at roughly –6 to –14 bar in spring, more stress later in the season) are several bars wide. A small systematic difference when trees are very wet doesn’t move you out of the correct range.
So, in practice:
- If your almond guideline says “irrigate around –14 bar at hull-split”, you now watch your FloraPulse midday SWP and irrigate when the daily minimum approaches –14 bar.
- If your grape guideline says keep vines between –7 and –10 bar, you use that exact same band on the FloraPulse midday chart.
Your trees don’t care which device you used — they only “feel” the actual water tension.
4. Day-to-day irrigation with FloraPulse (mental + operational shift)
Once FloraPulse is installed and the dashboard is set up, your weekly routine becomes much simpler:
- Look at the FloraPulse app instead of going to the field with the bomb.
- Open the dashboard on your phone or computer.
- For each block, glance at yesterday’s midday SWP (the lowest point on that day’s curve) and, if available, the color-coded stress bar for your crop.
- Compare directly to your usual pressure-chamber thresholds. For each block, ask the exact same questions you used with the bomb:
- Is midday SWP wetter than my “target band”? → I’m probably over-watering; consider stretching the interval.
- Is it sitting within my band? → Stay the course.
- Has it dropped past my “irrigate now” level? → Schedule irrigation.
- Use the 24/7 curve to confirm the pattern.
- Before irrigation, you should see a saw-tooth pattern: midday SWP slowly getting more negative day after day.
- After irrigation, the tree should recover toward the “fully irrigated” line, then start drying again.
- If the tree never dries between sets, irrigations are too frequent. If it crashes very negative before you irrigate, you’re waiting too long.
Operationally, the change is:
From: drive out at midday, bag leaves, pressure-bomb a handful of trees, write down the values.
To: open an app, look at a line on a graph, and decide “we’re in range / let’s wait / time to irrigate,” using the same numbers you already trust.
5. What healthy FloraPulse data should look like
This section is meant to give you a quick “gut check” for what normal FloraPulse data look like at different time scales.
5.1 Two days of SWP – the daily heartbeat
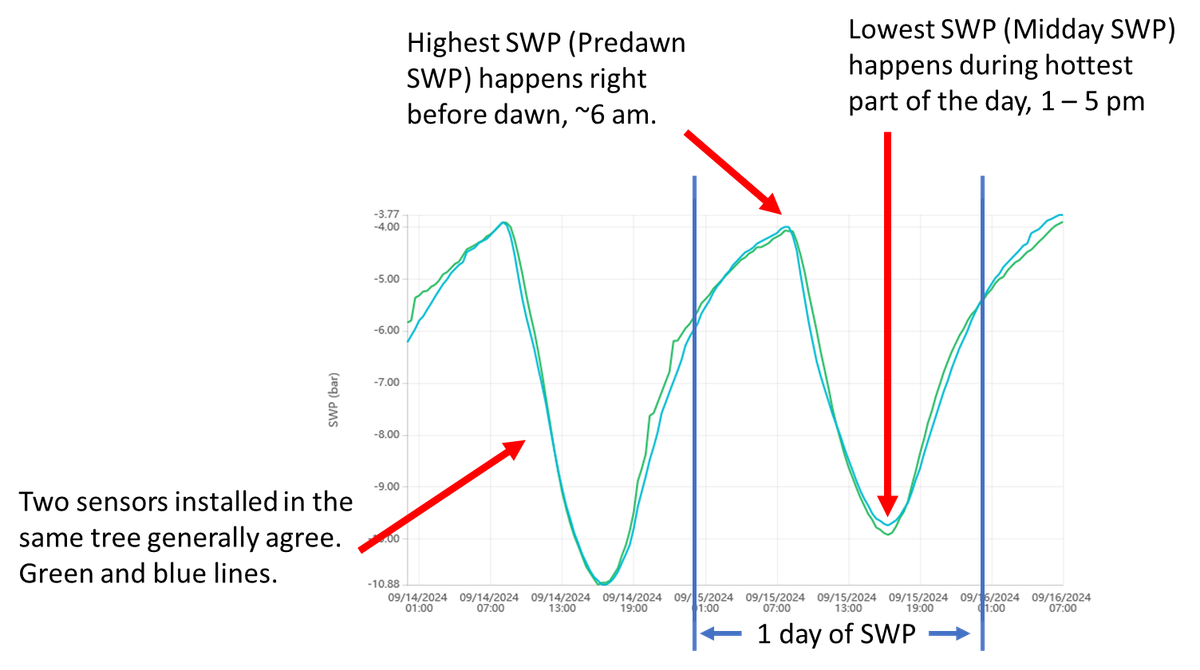
On a typical summer day, you should see:
- Overnight recovery: SWP gets less negative through the night and reaches its highest (wettest) value just before dawn — this is your predawn SWP.
- Daytime drying: As the sun comes up, SWP becomes more negative, reaching the lowest point during the hottest part of the day — this is the midday SWP.
- Evening recovery: As temperature and demand drop, the curve comes back up again.
If you have two probes in the same tree, their curves should track each other, with some differences being completely normal.
5.2 Two weeks of SWP – the irrigation saw-tooth
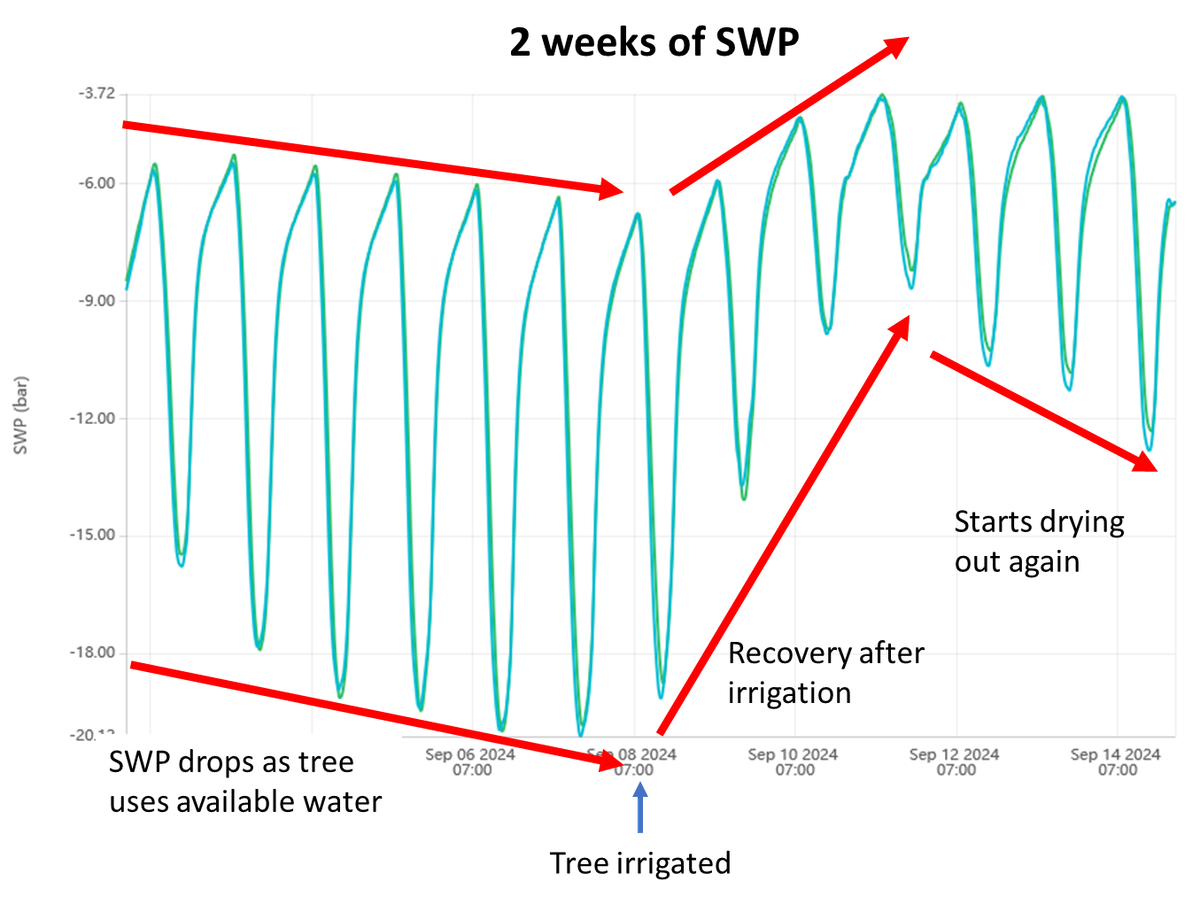
Over several days you want to see a pattern like this:
- After an irrigation, the whole curve shifts up (less negative): the tree recovers toward its “fully irrigated” level.
- Between irrigations, each day’s midday SWP drops more negative, showing the tree is using soil water.
- Predawn SWP usually changes only a little during drying and recovery — most of the change happens at midday.
This dry-down then recovery cycle is exactly what you want: it means you’re waiting long enough between sets for the tree to actually use the water you apply.
5.3 Two months of SWP – seasonal blocks and stress levels
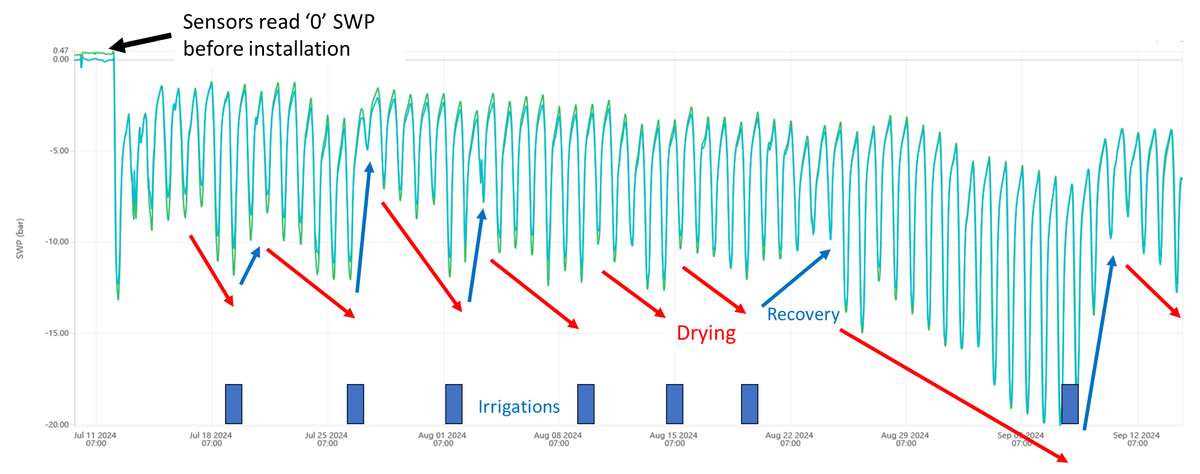
Across a couple of months you should see:
- A repeating pattern of drying ramps and recovery jumps tied to your irrigation schedule.
- Clear recoveries after each irrigation — sometimes in a single day, sometimes taking up to a week depending on soil and rooting depth.
- If you look at the very beginning before installation, you may see the sensors reading around 0 bar when sitting in water — that’s normal pre-install behavior.
If, instead, the line just trends drier and drier with no recoveries, it usually means irrigations are too small, too rare, or something in the system isn’t delivering water to that block.
5.4 One year of SWP – the big picture
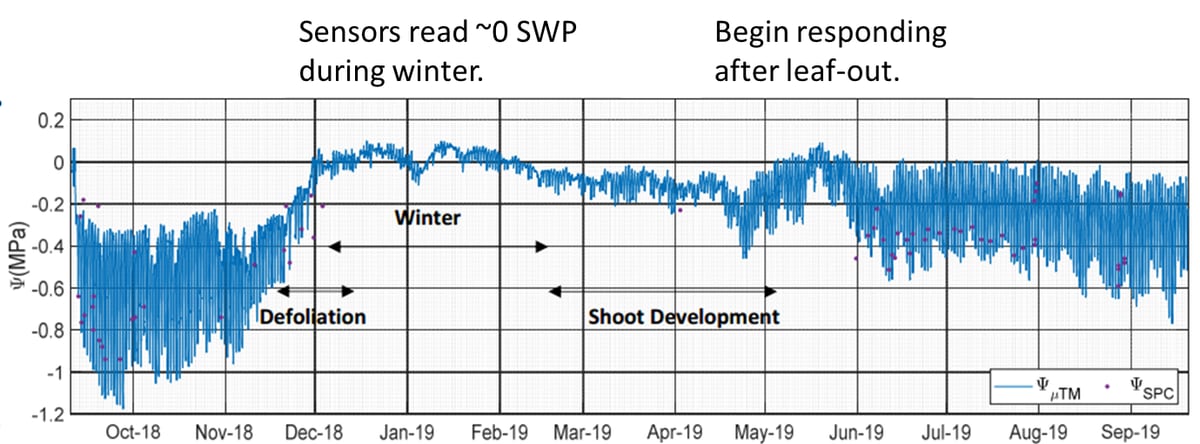
Zoomed out to a year, normal behavior looks like:
- Winter: As trees drop leaves and stop transpiring, sensors usually sit near 0 bar or slightly positive — the tree isn’t pulling water. In some species, the wound can close in winter, so readings may be less reliable.
- Spring: After leaf-out, a clear daily up-and-down pattern appears again as the canopy starts using water.
- Summer: Midday SWP becomes more negative as days get hotter and drier; this is where your irrigation thresholds really matter.
- Late fall/winter again: SWP flattens back toward zero as the tree shuts down.
Because winter wound closure can affect accuracy in some crops, FloraPulse generally recommends removing or reinstalling probes in spring after leaf-out for best data.
If your data look roughly like these examples, you can be confident the sensors are “seeing” the tree correctly and focus on fine-tuning irrigation.
6. Benefits and a few small drawbacks
Benefits
- No more midday labor. Sensors measure every ~20 minutes and upload hourly; you can check any time.
- Use the science you already know. Because FloraPulse measures the same SWP used to build pressure-chamber guidelines, you can apply decades of research directly.
- See trends, not snapshots. Continuous data show how quickly blocks dry, how fast they recover, and how heat waves or irrigation changes affect stress.
- Remote visibility and easy sharing. Consultants, PCAs or researchers can log in to the same dashboard and discuss decisions with you.
- Support and replacements baked in (for subscriptions). Yearly probe refresh and hardware replacement are part of the service, so you’re not left alone if something fails.
A few small drawbacks
- Installation effort. Each sensor takes some careful drilling and sealing, but most growers install their own after watching the video.
- Not a forever sensor. For best accuracy, probes are typically replaced or reinstalled each season, especially in some species.
- Requires power and cell signal. Dataloggers need sun on the small solar panel and enough signal to upload.
7. Take-home message
You don’t have to relearn irrigation or re-calibrate your whole farm. FloraPulse is simply a continuous, automated way to get the same SWP numbers you’ve been using for years with the Scholander chamber.
Keep your existing thresholds, read the midday SWP from the FloraPulse dashboard instead of from a leaf in the bomb, and use the extra trend information to fine-tune timing — all without the midday hassle.