| ||
Two awards, the three papers to read, and the first macadamia season | ||
Hello there, | ||
It's been busy! Eleven new peer-reviewed papers have discussed microtensiometers since March. Three are below in depth: a 20-author methods review in New Phytologist, a perspective from Gregory Gambetta with an r² table by crop, and three seasons of olive data that make our case for reinstalling every spring; the other eight follow in a November issue. The International Society for Horticultural Science handed us its Horticulture Innovation Award in Kyoto. Our first macadamia season produced 92+ days of continuous stem water potential in a crop the literature calls isohydric. And we are gathering our first data from pomegranate, finally! | ||
Also inside: why a microtensiometer comes out of the tree every spring, with the data behind it, and the ten-day stem water potential forecast, which is now live. Every item links to the paper or the data, and a reply to this email lands with Michael. | ||
Two awards | ||
| ||
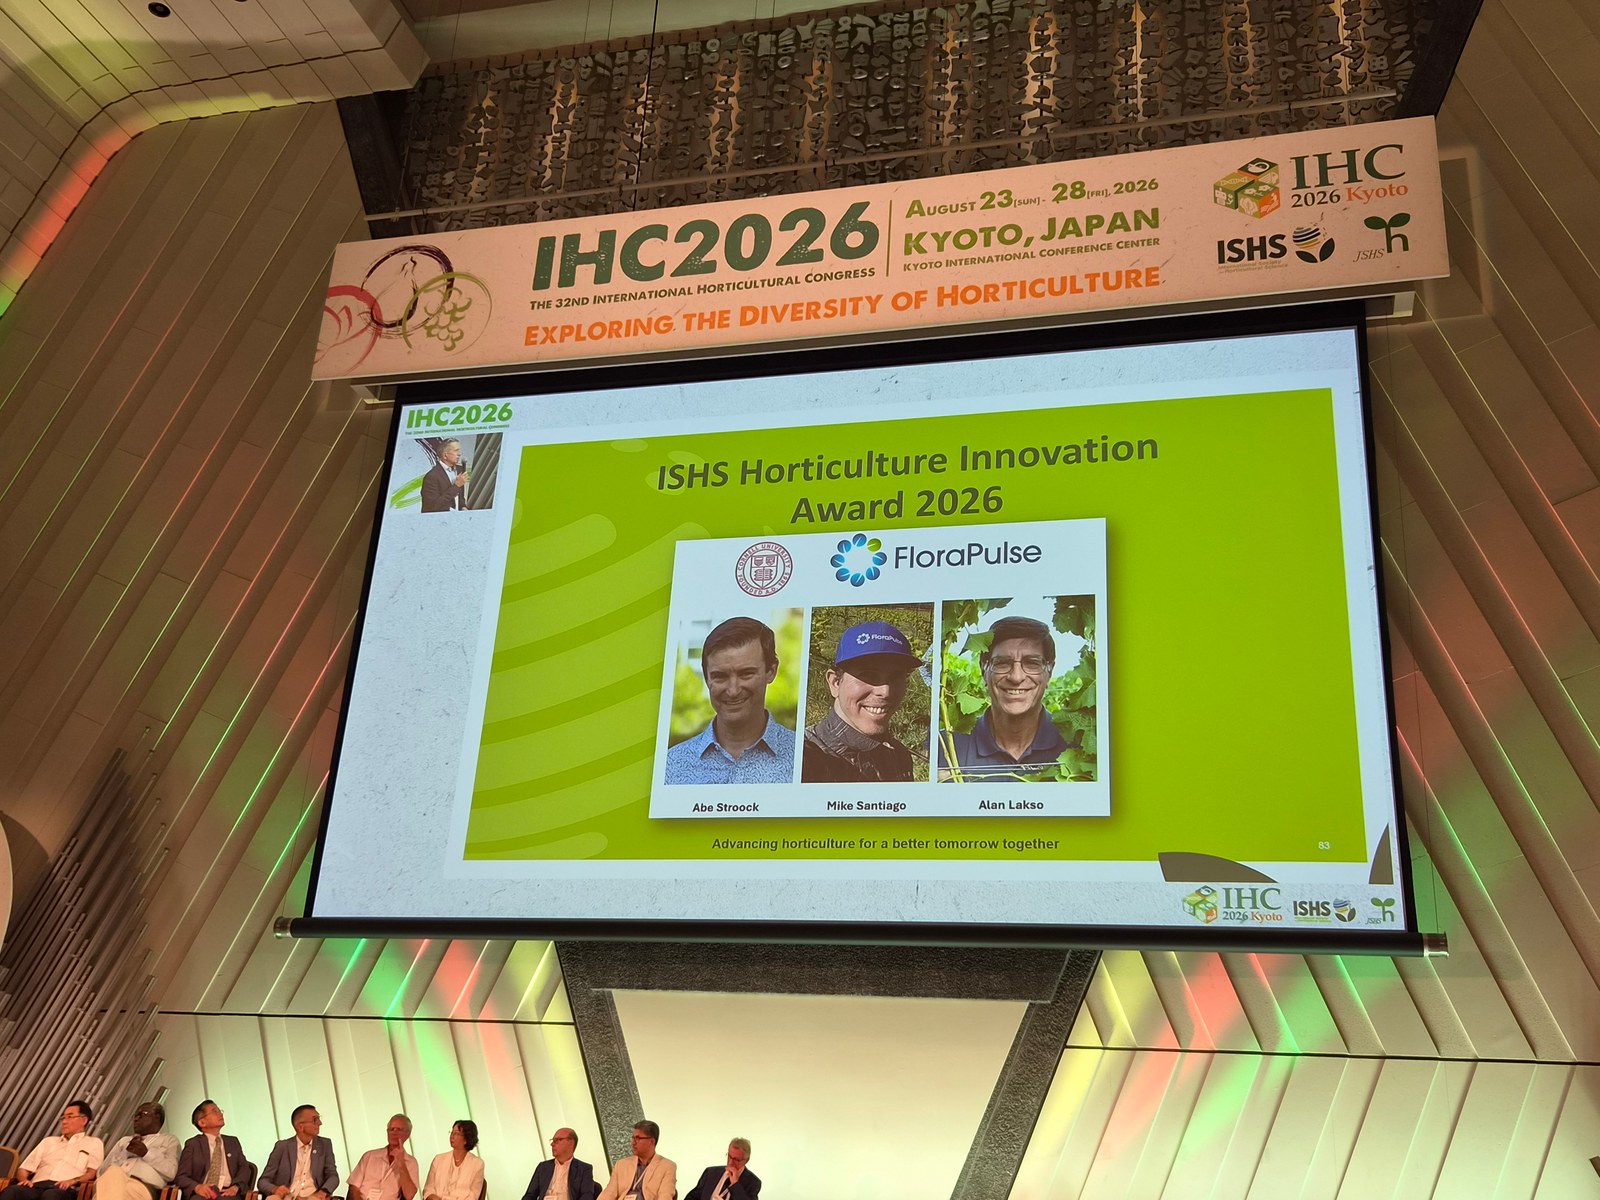
ISHS Horticulture Innovation Award 2026 | ||
Presented on 26 August at the International Horticultural Congress in Kyoto, in front of ~4,000 horticulturists. It is the highest recognition the ISHS Council gives for innovation in horticulture, awarded five times since 2014. The slide named Abe Stroock, whose Cornell lab built the microtensiometer, Alan Lakso, who first put it in apple trees, and Michael Santiago, who made it survive outdoors. | ||
We're so proud! Over the past year research groups put the sensor into cherry, olive, peach, persimmon, mandarin, Scots pine, beech and city street trees and wrote plainly about what worked and what did not. Three of those papers are below. | ||
Smart Meter of the Year, 2026 AgTech Breakthrough Awards | ||
Announced 20 August in the irrigation category, for the microtensiometer itself: a sensor that sits inside the trunk and reads stem water potential every 20 minutes for the whole season. More than 300 of them are reporting across California this week in almond, wine grape, prune, olive and citrus. | ||
New peer-reviewed research | ||
Eleven papers have been added to our resources page since March, which now lists more than 50 publications. The three to read first are below. | ||
Methods and perspective | ||
Continuous monitoring of plant water potential: sensor-based approaches and best practices | ||
Restrepo-Acevedo, Guo, Novick, Humphrey, Zweifel, Konings and 14 others · New Phytologist 251, 2026 · doi 10.1111/nph.71194 | ||
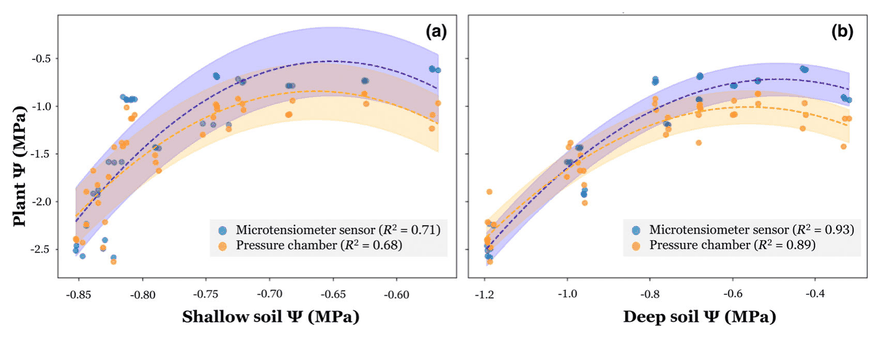
Twenty authors from WVU, Indiana, Stanford, WSL, ETH and elsewhere review every route to continuous water potential and set out best practices for each. Microtensiometers get their own section, and this is the methods reference to hand a new student. | ||
| ||
| ||
Can micro-tensiometers move us beyond the Scholander pressure chamber? | ||
Gambetta (Bordeaux Sciences Agro, INRAE) · Journal of Plant Hydraulics 11, 2026 · jplanthydro.org/article/view/9885 · open access | ||
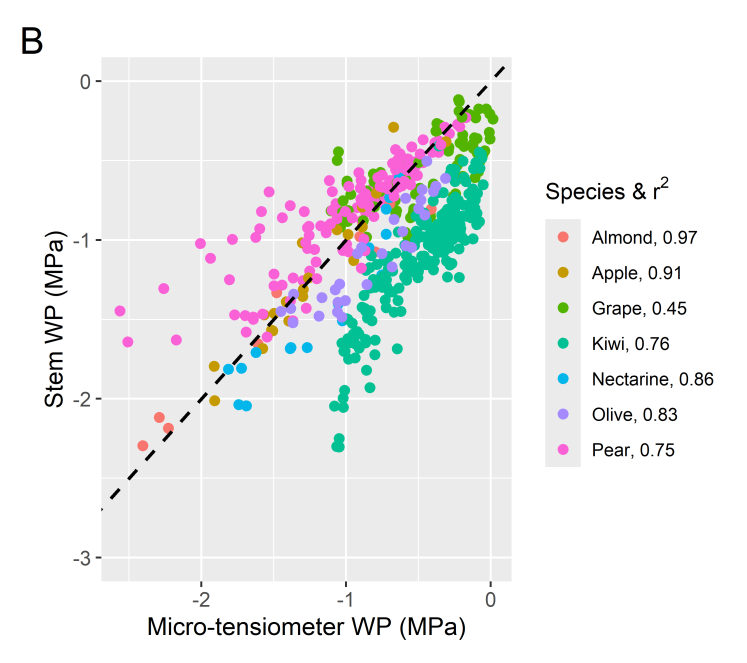
His Fig. 1B pools every published comparison of trunk microtensiometers against chamber Ψstem, by crop. The r² runs from 0.97 in almond and 0.91 in apple down to 0.45 in grape, with olive at 0.83; the same sensors against leaf Ψ fit far worse. | ||
| ||
| ||
Orchard crops | ||
Vanella, Pérez-Pérez, Intrigliolo, Bonet, Tasa, Badal, Martínez-Gimeno, Ramírez-Cuesta (Catania, IVIA, CIDE) · Agricultural Water Management 333, 2026 · doi 10.1016/j.agwat.2026.110633 · open access | ||
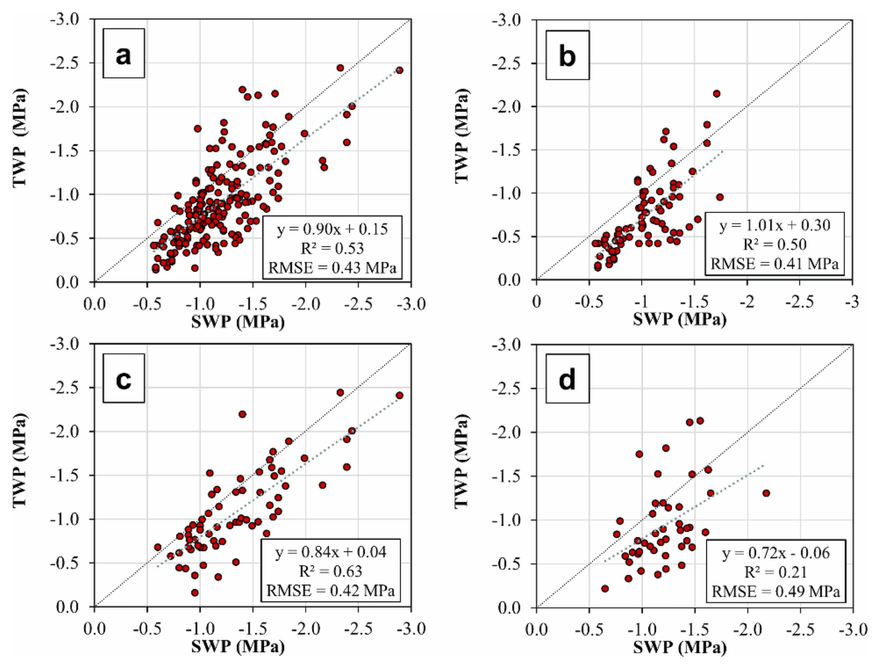
Three seasons in a commercial olive orchard in Castellón. The microtensiometers separated full from deficit irrigation where thermal indices and spot chamber readings did so only occasionally. The part to read closely: the sensors went into the trunks in spring 2022, and the paper describes no re-installation over the three seasons, nor how the chamber readings were paired with the trace. Their agreement with the chamber fell from R² 0.50 and 0.63 in the first two seasons to 0.21 in the third. The authors call for periodic re-installation and list new xylem laid over the sensor tip among the possible causes. More on this in the next section. | ||
Why the sensor comes out every spring | ||
Vanella's olive result deserves its own section, because it is the question we hear most from labs planning a multi-year trial. The sensors went into the trunks in spring 2022 and stayed there. Their agreement with the chamber held for two seasons and fell apart in the third, while the sensors still separated the irrigation treatments. The authors list three possible causes: the trees' adjustment to years of deficit irrigation, continuous readings compared against spot chamber readings, and new xylem laid down over the sensor tip. We read it as the third, an aging installation rather than failed sensors, with the second adding to it. Here is why. | ||
| ||
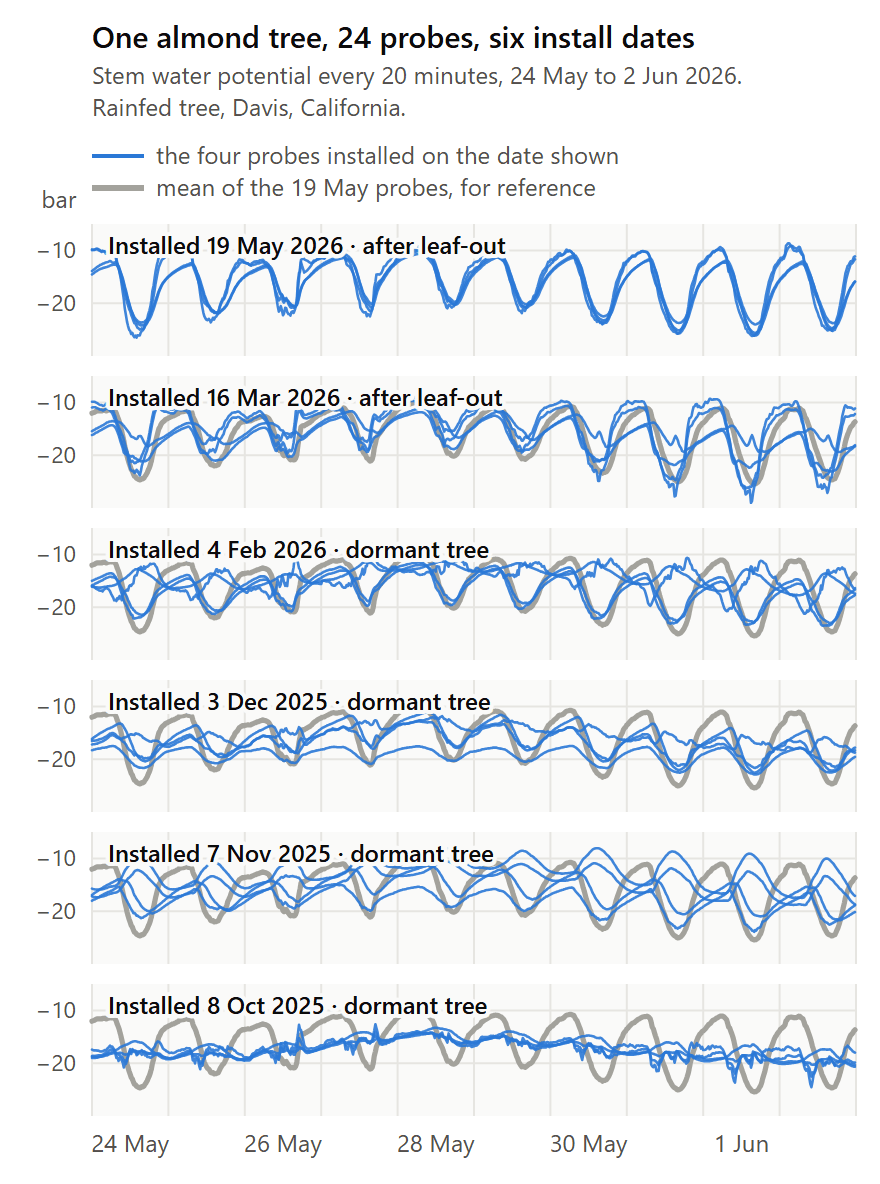
The probe reads water potential through the wood at the bottom of its hole, in the outer, conducting xylem, and a fresh install follows the tree with a lag of one to three hours. The tree treats the hole as a wound, and two things then happen at different speeds. Within weeks to months the wound response plugs the nearest vessels: gum in Prunus, tyloses or callus in other species. Over years the cambium buries the site under new xylem, which is the slow process Vanella's olives showed in their third season. Either way the path from the probe to the active xylem gets longer and narrower, and less of the daily signal gets through. The probe still sits near the tree's average water potential, but it no longer follows the daily cycle: the predawn reads too dry, the midday too wet, and a comparison against a midday chamber reading drifts as the swing shrinks. In almond the closing happens over the winter: a probe that overwinters in the trunk is damped by spring, while one installed after leaf-out follows the tree through the season. In olive, an evergreen with no real dormancy, it took three seasons. | ||
We tested this directly last winter. Twenty-four 7 mm probes went into one rainfed almond tree in Davis on six dates, four per date: October, November, December and February while the tree was dormant, and mid-March and mid-May after leaf-out. All of them ran through the summer. By late May every winter install had lost most of its daily swing: the October probes moved 3 bar a day against 12 for the May probes, and the earlier in the winter a probe went in, the worse it was. The probes installed after leaf-out kept their swing all season, a median 8 to 12 bar a day in August against 6 to 7 for the winter group. The daily average was the same for every date, within 2 bar, so a closed-over install still sits near the tree's mean state; what it loses is the dynamics. Installation depth made no consistent difference. It is one tree, but it is the reason for our rule: install after leaf-out, and a probe that has overwintered in the trunk comes out in spring. | ||
| ||
The pairing rule matters as much as the install. A chamber reading is an instant; the sensor reaches the day's minimum one to three hours after the leaves do, a lag Gambetta's review also notes. On the almond tree above, the May probes bottomed out around 16:00 and read about 2 bar wetter at 13:00 than at their minimum; the October probes bottomed out near 19:00 and had barely started down at 13:00. Pair a 13:00 chamber reading with the 13:00 sensor reading and you compare the leaf's minimum with a sensor still on its way there. The miss is 2 to 4 bar, so the fit worsens as the season progresses. Vanella's paper does not say how its 92 chamber readings were paired with the trace, and the authors list the continuous-versus-spot comparison among the causes of the decline, so part of the 0.21 may be the pairing. Our rule, and the one on the chamber-comparison card: take the chamber reading between noon and 4 PM and compare it with the lowest sensor value of that day, never with the reading at the same instant. Pairing with the minimum still shows a closed-over install: a healthy probe's minimum lands within about 2 bar of the chamber, a closed-over probe's minimum comes out several bar too wet, and that gap is the reinstall signal. | ||
What it means for a trial: install after leaf-out, and for a second season move the probe to a fresh spot on the trunk, 10 cm or more from the old hole. The probes are reusable: pull, store the tip in deionised water, reinstall. The probe reuse manual has the procedure, SDI-12 users can bench-test a removed probe in the browser before it goes back in, and the over-winter troubleshooting card shows what an aging install looks like on the chart. Budget one reinstall per season in a multi-year design. If a study needs a long series of mean water status rather than midday values, an old install may serve, and we are testing that idea; for thresholds and midday comparisons it will not. | ||
New crops: macadamia and pomegranate | ||
Macadamia: 92+ days of continuous stem water potential in an isohydric crop | ||
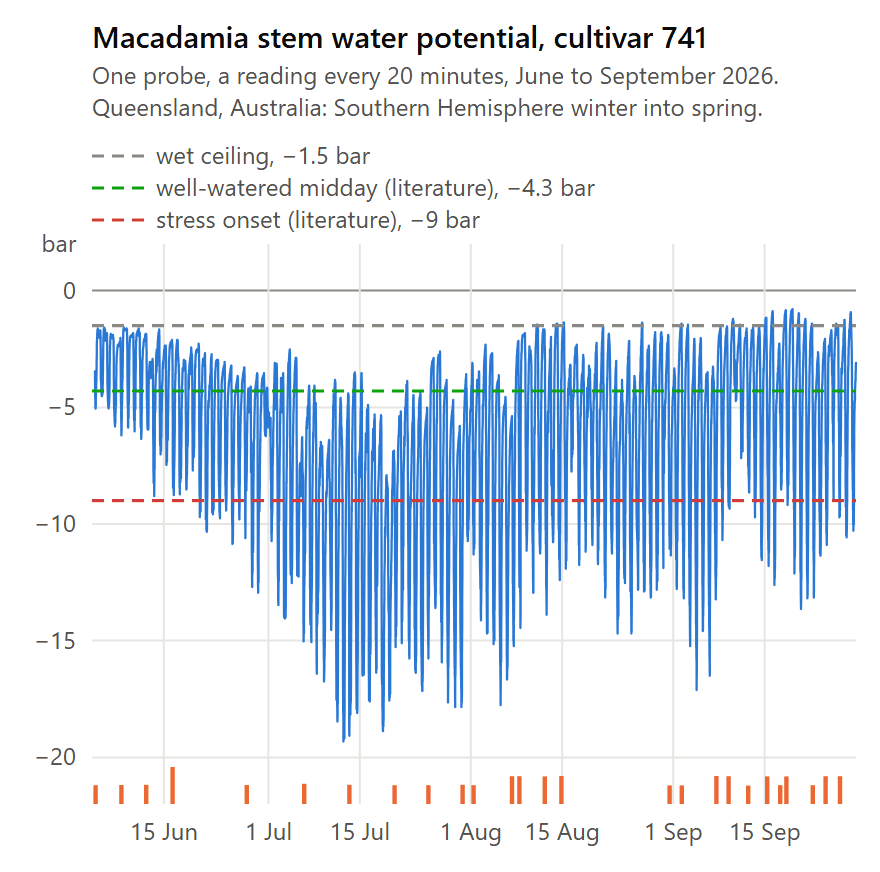
Our first macadamia installation went into a commercial orchard in Queensland, Australia, in early June, the Southern Hemisphere winter: 7 mm probes, two per tree, on cultivars 741 and A203. At day 92 three of the four probes were still cycling cleanly. The daily swing grew with evaporative demand, from about 6 bar in June to 12 in July and 14 bar on the first 32 °C day in September. The irrigation shows too: through July, on short sets of about an hour, the predawn sat near −5 bar with middays to −19; two longer sets in early August brought the predawn back to −2 bar within a day. | ||
The literature describes macadamia as isohydric, with a well-watered midday stem potential near −4.3 bar and stress onset near −9. These trees swung 10 to 15 bar a day once demand picked up. | ||
| ||
| ||
Pomegranate: the first probes are in | ||
The first FloraPulse probes went into a pomegranate on September 4th, a validation tree in Davis, California, with pressure-chamber readings taken alongside. We know of no continuous stem water potential record in this species. The chamber literature puts well-watered midday Ψstem near −8 to −11 bar in spring, drifting to −12 to −15 bar in midsummer even under full irrigation (Intrigliolo et al. 2011 among others). Galindo et al. 2014 tied fruit cracking after rain to how far water potential had fallen in the weeks before it. This is the kind of swing a continuous sensor sees and a weekly chamber reading does not. We are watching the first weeks of data now and will report once we understand what the probes are telling us. | ||
Ten-day stem water potential forecasts are live | ||
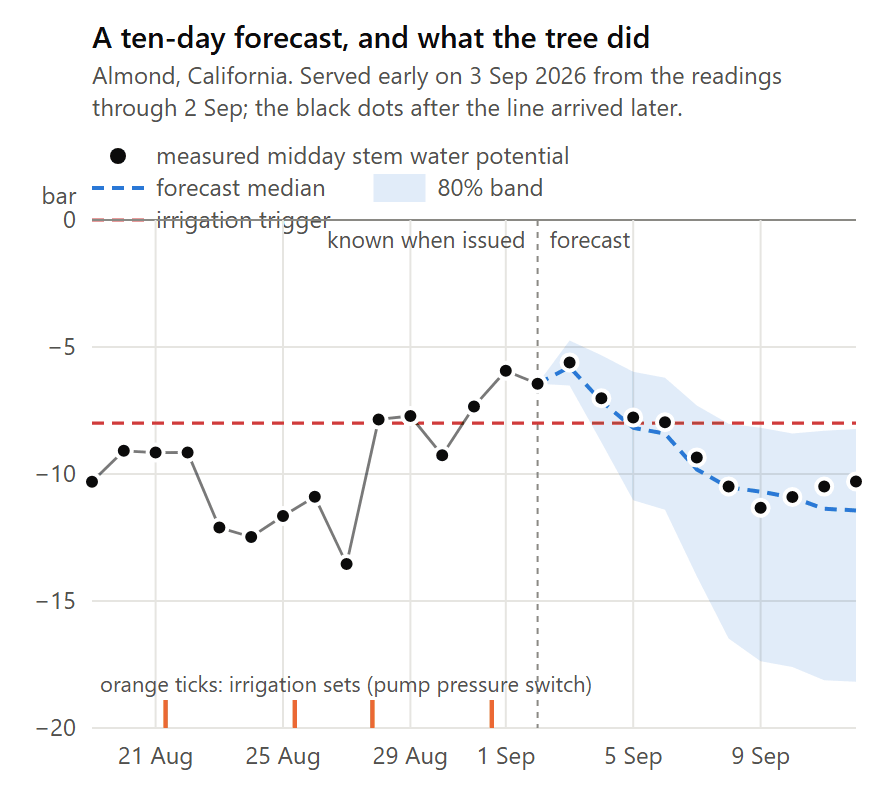
This summer we built a ten-day forecast of midday stem water potential and switched it on for almond and grape. One model per crop family learns from the fleet's history: past readings, irrigation records, weather, and the ten-day weather forecast. Every morning it draws a fan on the customer's chart, a median line and a band, assuming no irrigation, so it answers "what happens if you do not water" and warns when the trend will cross the irrigation trigger; after a set it re-anchors on the next reading. Every forecast is scored against what the trees then did, and the models retrain as the season's data come in. The early results look good, and the figure below is one clean case; we will report properly once a full season is in. | ||
| ||
Come see us in person | ||
WIN Expo, the North Coast Wine Industry Expo, Santa Rosa, 3 December 2026, booth 331. | ||
The Almond Conference, Sacramento, 8 to 10 December 2026, booth 236. | ||
Unified Wine & Grape Symposium, Sacramento, 26 to 28 January 2027 (exhibits on the 27th and 28th), booth 136. | ||
Bring your data and we will look at it together at the booth; reply to this email to schedule a meeting. | ||
Writing FloraPulse into a proposal | ||
Proposal season is here, and we would rather you spend it on the science than on describing the instrument. Reply and within a few days we will send: | ||
| ||
| ||
Scientists: use FloraPulse probes in your next research trial.
| ||
Michael Santiago, PhD | ||
|
You are receiving this as a researcher on the FloraPulse list. Update preferences or unsubscribe FloraPulse Co, 720 Olive Dr Ste E, Davis, CA 95616 |