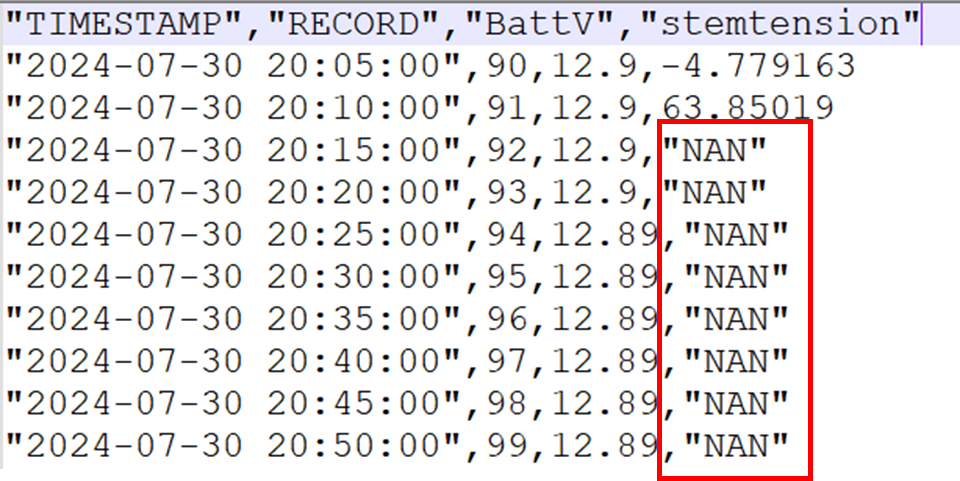
Is your data looking unusual? Let's figure it out.
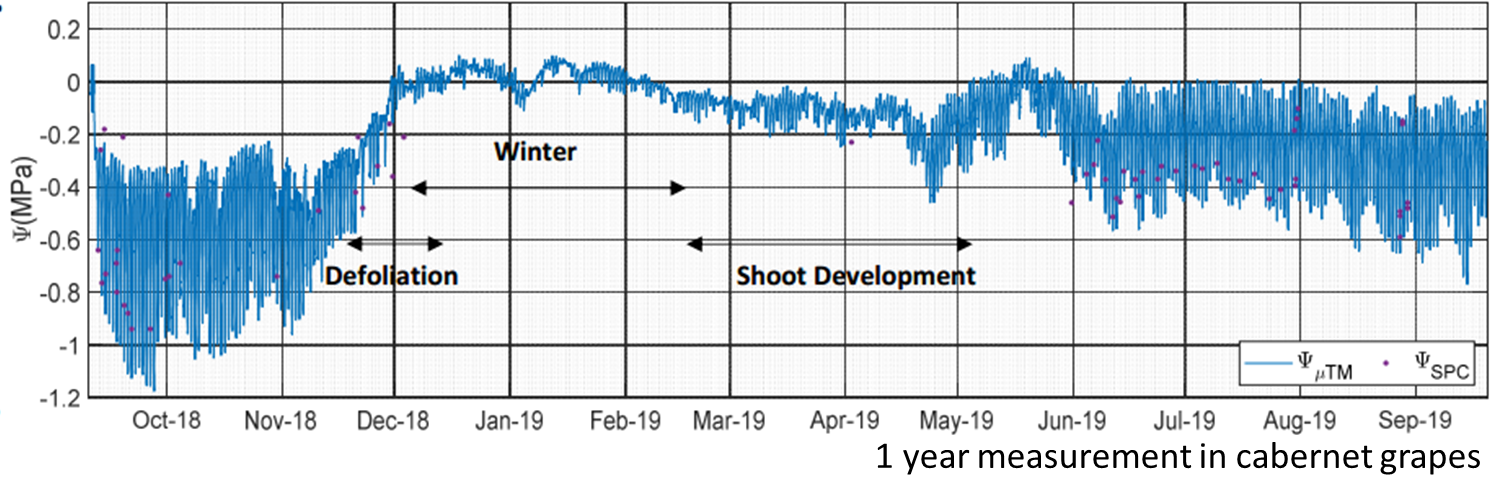
FloraPulse measures the same value as the Schölander pressure chamber — stem water potential — but continuously. The sensor itself responds in under 15 minutes; once installed in a tree, its response time is 1–3 hours, and it slows over the season as the mating compound and the xylem near the wound gum up.
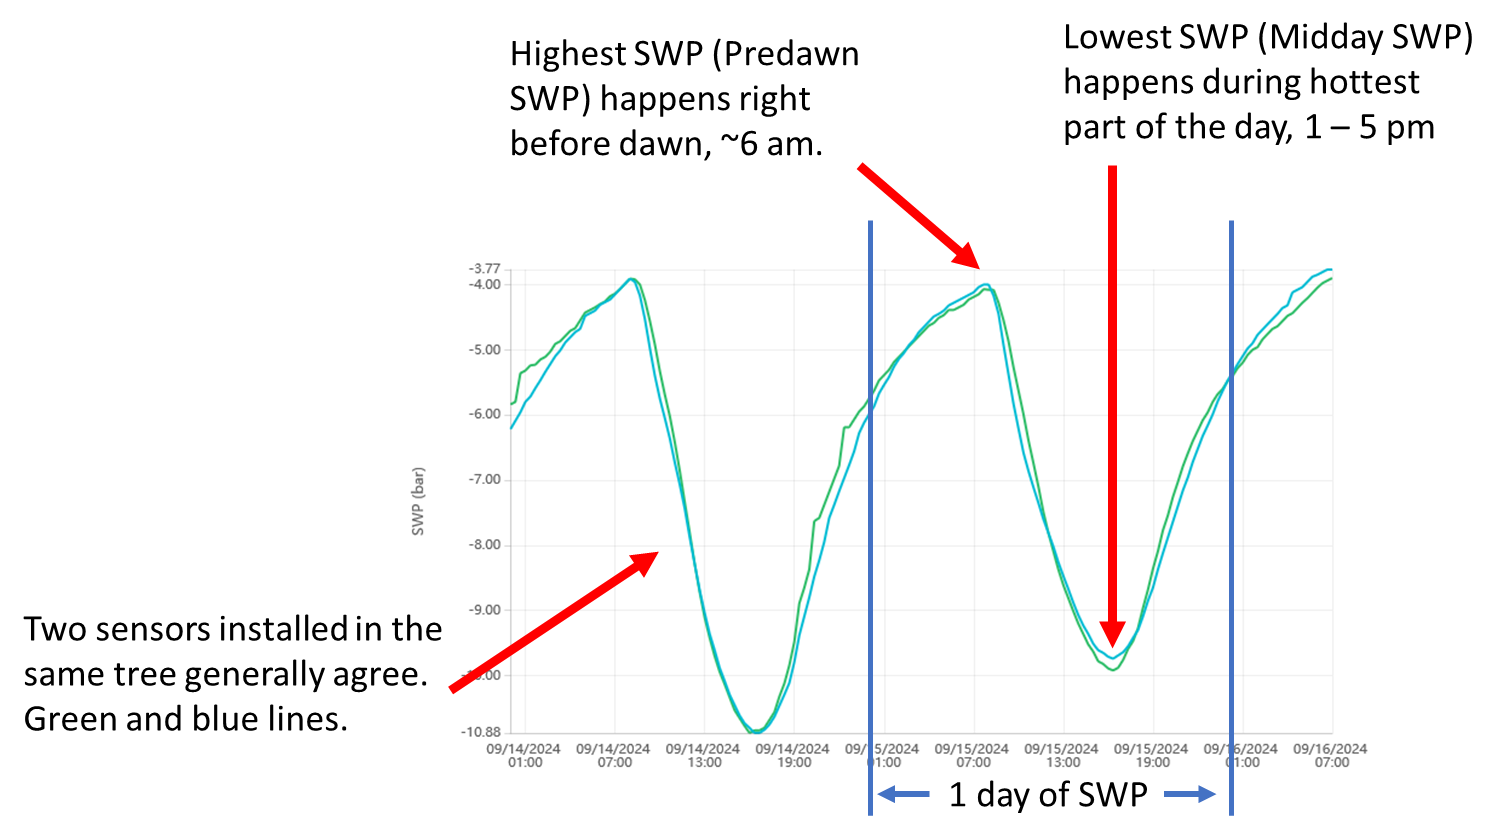
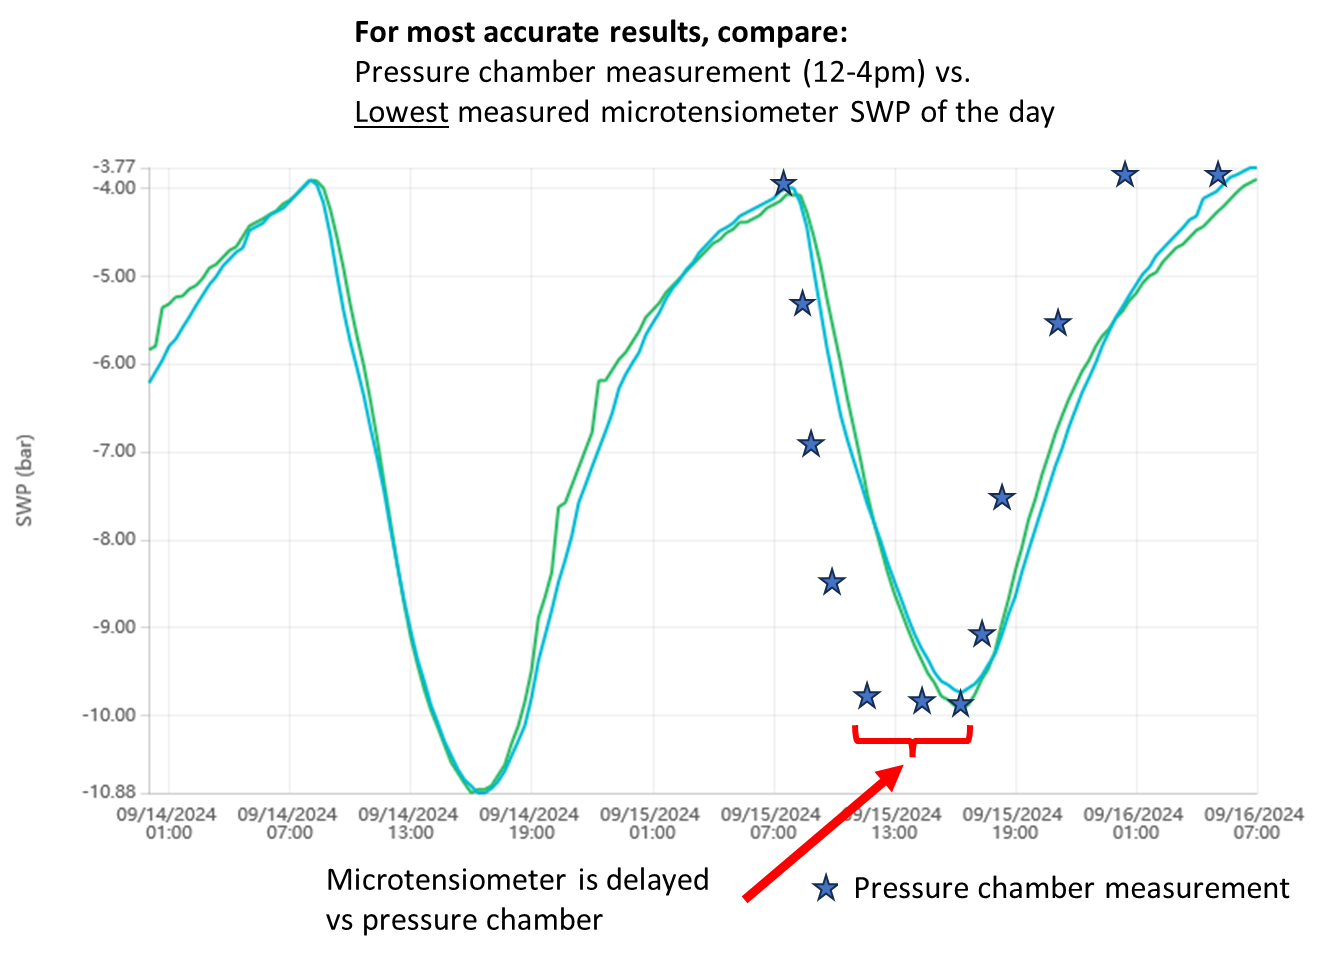
So the reading lags the tree by 1–3 hours: if the tree bottoms out at noon, the sensor shows that low around 3 PM. Because the tree sits near its daily minimum for about 4 hours, this lag doesn’t affect irrigation decisions.
To compare against the pressure chamber: take chamber readings between 12–4 PM and compare them with the sensor’s lowest reading of the day (the “midday SWP”) — not the sensor value at the same instant.
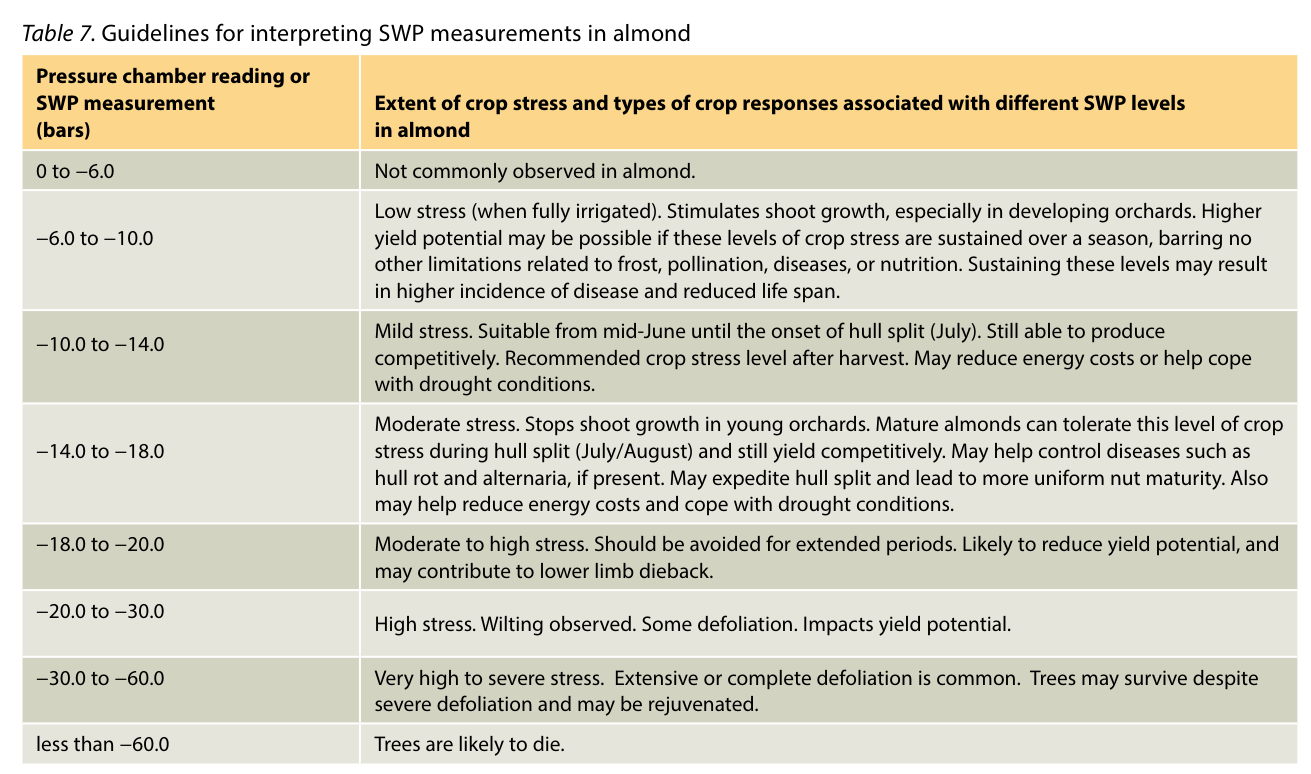
For crops with established guidelines (almond, apple, prune, walnut, wine grapes), you can use the midday SWP thresholds developed by scientists over the last 30+ years. FloraPulse sensors measure the same thing as the Schölander pressure chamber — but continuously and without the manual hassle. Refer to our crop validation database for links to published guidelines.
Method 1: Using midday SWP thresholds
Take the lowest SWP value each day as the midday SWP. Irrigate when the midday SWP drops below your desired threshold. For example, almonds should be kept between -6 to -14 bars of midday SWP during spring. Irrigate at -14 bars, the tree recovers to about -6 bars, then gradually drops again over days until it reaches -14 and it’s time to irrigate again.
Method 2: Using bars below baseline (more accurate)
A more accurate but more complex method involves calculating the baseline midday SWP (the midday SWP a well-watered tree would have given the current weather) and irrigating based on how far below baseline the tree has dropped. This accounts for the fact that even well-watered trees have lower midday SWP on hotter days.
Method 3: Using continuous 24/7 SWP data
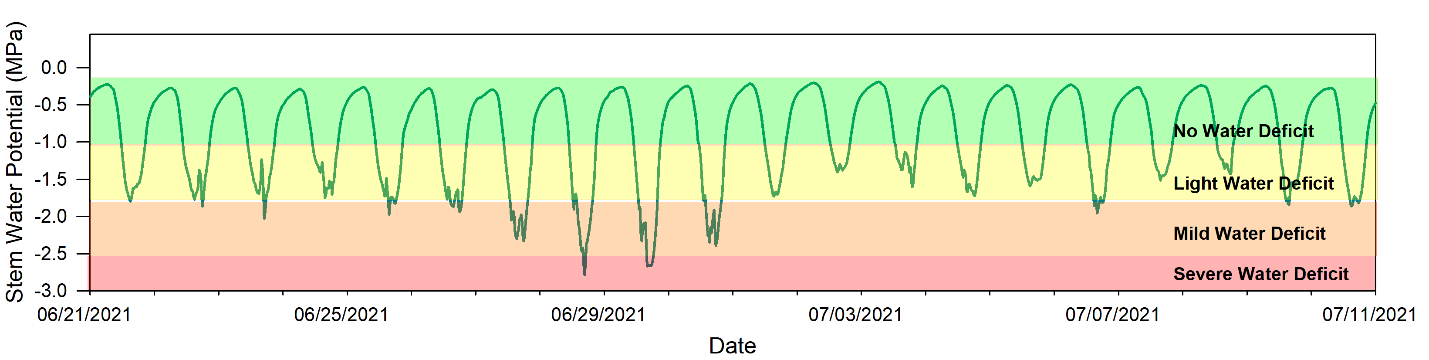
You can also use the continuous 24/7 SWP data directly. Look at the lowest point each day and compare it against your irrigation threshold. If the lowest SWP for the day is below your desired stress level, irrigate. This approach works well because you can see the full diurnal pattern and how the tree responds to irrigation in real time.
FloraPulse sensors accurately measure SWP in most crops, but stress level guidelines are incomplete or lacking for many species. You can still use the data effectively by following this 3-step process:
Step 1: Observe the SWP trend under your normal irrigation
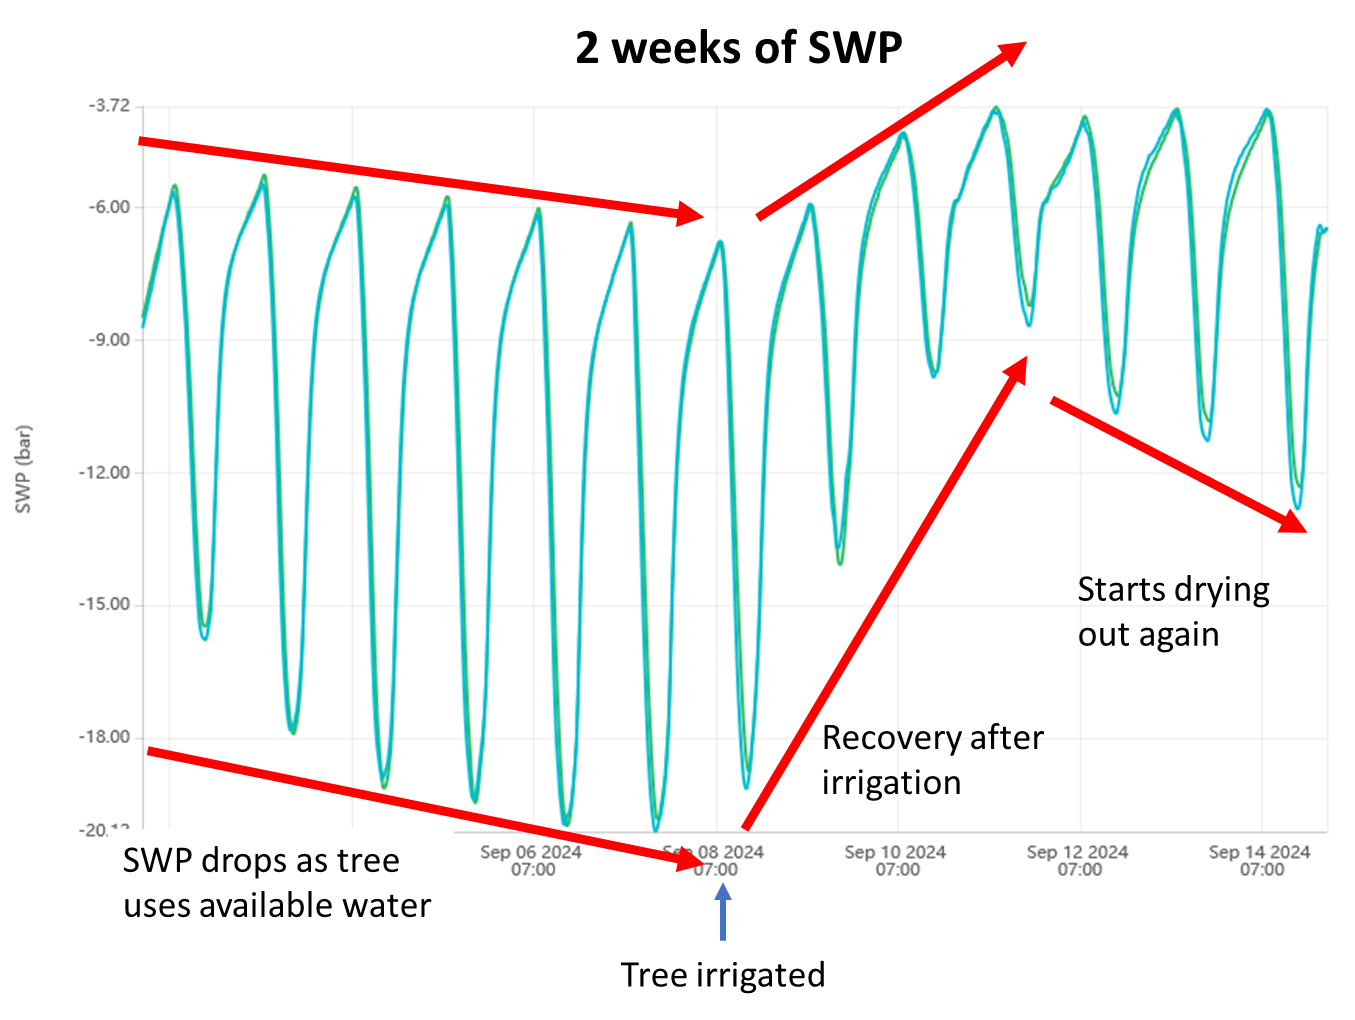
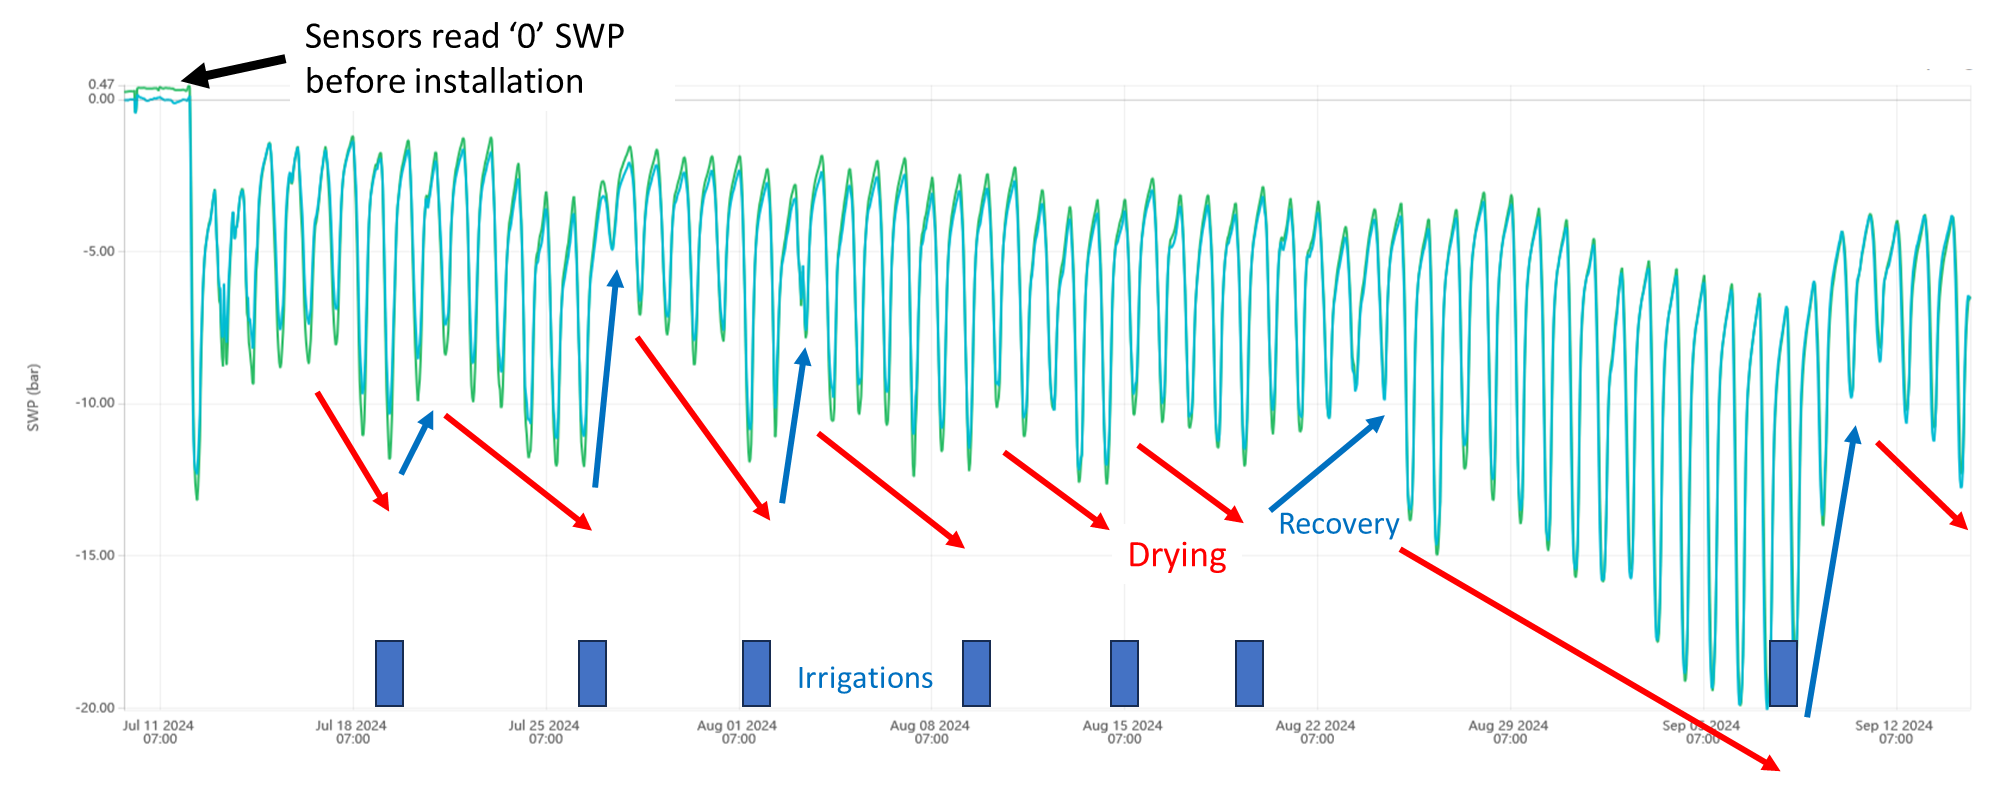
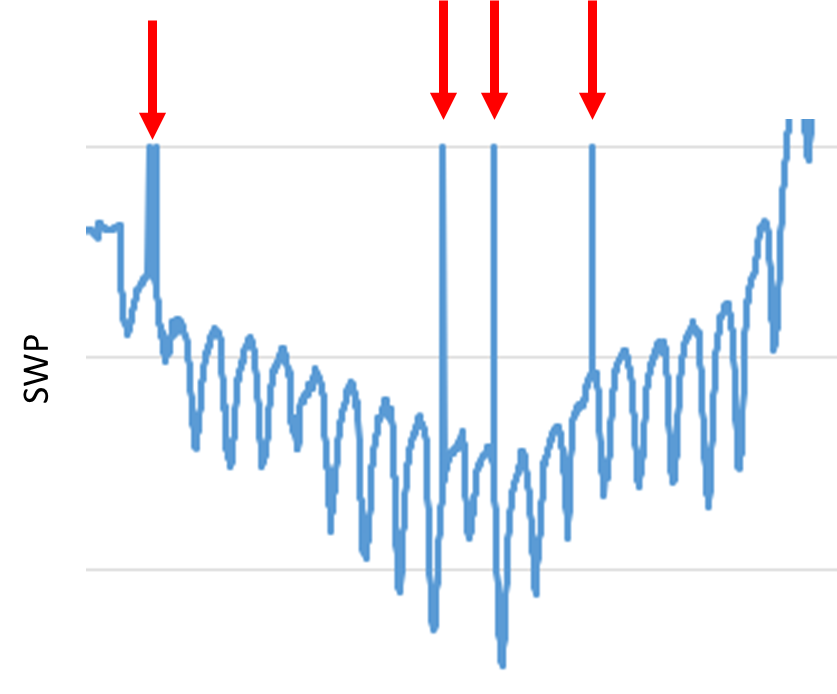
You should see a see-saw pattern: midday SWP decreases for a few days post-irrigation as the tree uses water, then recovers after you irrigate again. If you see this drying-and-recovery cycle, it means you’re waiting long enough between irrigations for the tree to use the water.
Step 2: Tweak your irrigation timing
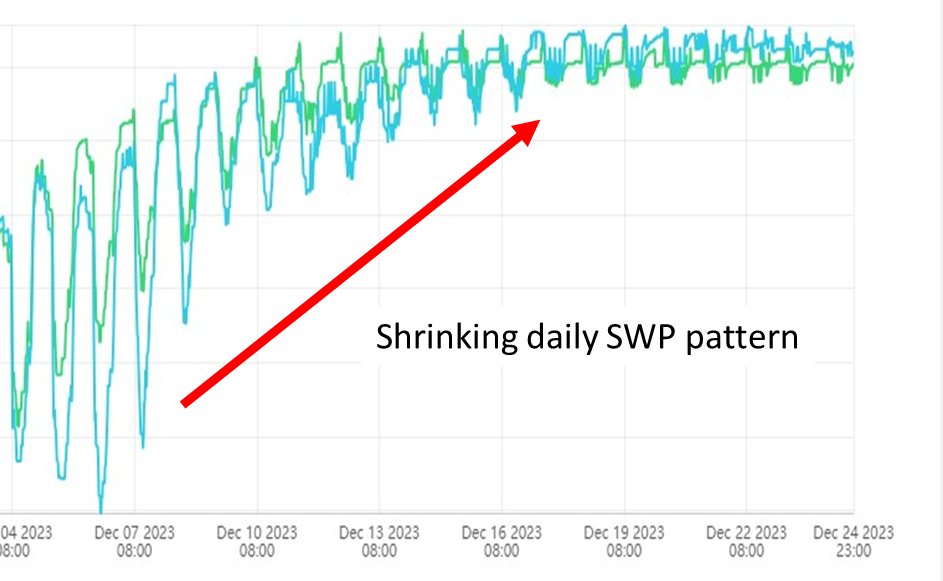
Midday SWP changes very little day to day? You may be irrigating too frequently — the tree doesn’t have time to use the water. Try increasing the time between irrigations.
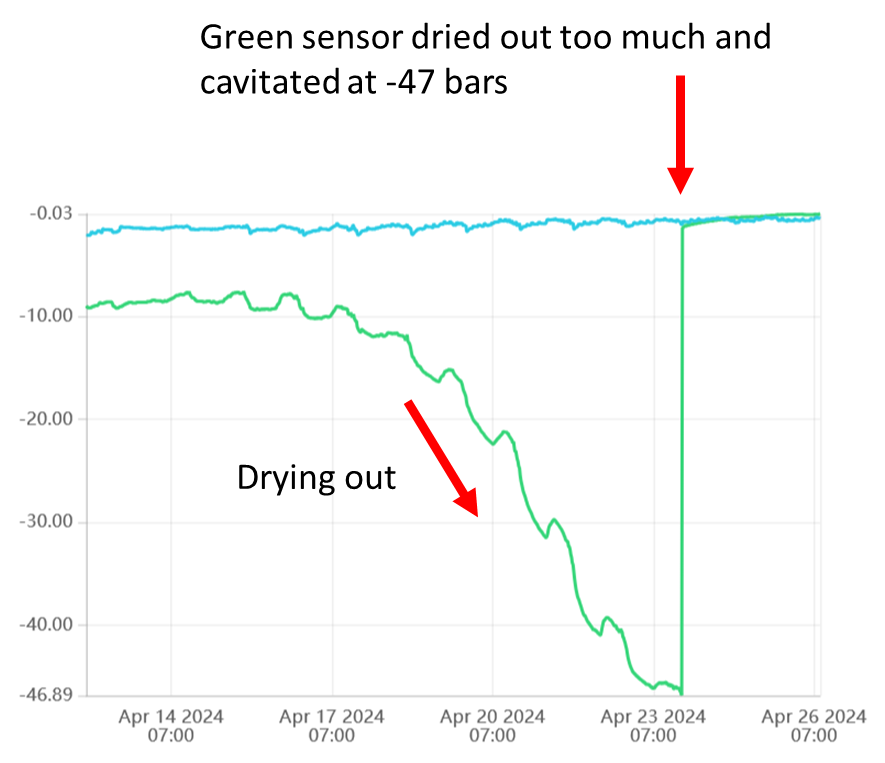
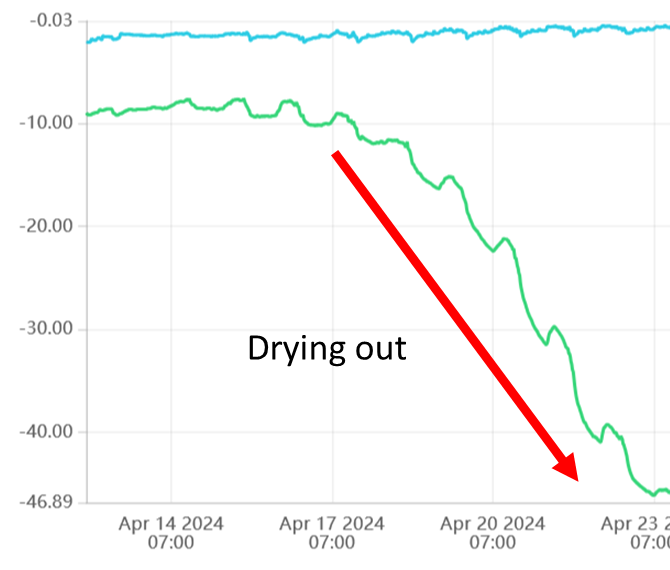
Midday SWP crashes to very negative values? You may be waiting too long. By the time stress is visible (drooping leaves), it’s often too late. Irrigate more frequently or earlier in the drying cycle.
Step 3: Tweak your irrigation amounts (optional)
FloraPulse does not directly recommend irrigation amounts, but you can use the SWP recovery pattern to fine-tune. Try slowly decreasing irrigation amounts and observe how it affects the time it takes for the tree to reach the threshold again. You may also combine FloraPulse with soil moisture sensors — FloraPulse tells you when to irrigate, and soil moisture tells you how much (irrigate until water reaches the bottom of the root zone, but no further).
See our resources page for detailed crop-specific guides and published research.
These are normal behaviors that scientists frequently ask about.
Select the pattern that best matches what you're seeing.
Every guide page in one place — click any topic, or copy its link to share.